
Monthly Review – July 2026
OUR PERSPECTIVE – THE GREAT SCARCITY
“AI runs on real hardware, real energy and real economics.” ~ Jensen Huang, Founder and CEO of NVIDIA
The Industrial Revolution created machines that replaced humans in the manufacturing economy. The artificial-intelligence revolution is creating machines replicating the human brain; and increasingly threatening to replace humans in the services economy. Investors are captivated by the intelligence. They may be overlooking what feeds it.
The next workforce will not eat food, commute to offices or sleep. Rather, it will likely consist of software agents working continuously in data centres, autonomous vehicles navigating public roads and humanoid robots operating in factories, warehouses and eventually our homes. All of them will consume one thing: electricity!
The scale could be extraordinary. Morgan Stanley estimates that nearly one billion humanoid robots could be in use globally by 2050, creating a market worth approximately $5 trillion. Goldman Sachs expects the humanoid market to grow from around 20,000 units in 2025 to 1.4 million by 2035. Meanwhile, robotaxis, autonomous trucks and industrial machines could convert another enormous pool of human activity into machine-powered labour.
Yet physical robots may be only the visible tip of the iceberg. Every knowledge worker could eventually employ several digital agents: researching, coding, negotiating, modelling and communicating around the clock. If intelligence becomes cheaper, we will not merely perform today’s tasks more efficiently. We will consume vastly more intelligence. That is Jevons Paradox: efficiency lowers the cost of a resource and can cause its total consumption to rise rather than fall.
The energy system is already feeling the first tremors. The International Energy Agency estimates that electricity generation required to supply data centres could rise from roughly 460 terawatt-hours in 2024 to more than 1,000 TWh in 2030 and 1,300 TWh by 2035. Those projections arrive before the mass adoption of humanoids, autonomous transport or billions of persistent AI agents.
This is why the greatest constraint on artificial intelligence may ultimately be something remarkably old-fashioned: dependable power. Chips can be designed rapidly and models improved overnight. Data centres can be built within three years, while new grid infrastructure can require five to fifteen years to plan, permit and complete.
Markets are pricing the creators of artificial intelligence as though exponential growth is possible. But exponential growth requires physical infrastructure. The beneficiaries may therefore extend far beyond semiconductors and frontier models to utilities, natural gas, nuclear power, copper, electrical equipment, cooling systems and grid infrastructure.
The greatest investment opportunity of the AI revolution may not be creating artificial intelligence. It may be powering artificial labour.
Exhibit 1: Artificial labour could triple global electricity demand by 2050.
Official forecasts imply annual electricity-demand growth of 2.2%–3.6%. A world containing billions of humanoid robots, autonomous machines and persistent digital agents could require growth closer to 4.4% – turning today’s 27,700 TWh electricity system into an 85,000 TWh system by 2050.
The most striking point is that the difference between the conventional base case and an artificial-labour scenario is 36,500 TWh – more than the entire world currently consumes!
| Scenario | Annual electricity demand (TWh) | CAGR (2025–2050) |
|---|---|---|
| Current consumption — 2024 | 27,700 | |
| Base case — IEA Stated Policies | 48,500 | 2.27% |
| High electrification — IEA Net Zero | 69,300 | 3.74% |
| Artificial labour market scenario | 85,000 | 4.59% |
Source: IEA.org, World Energy Outlook, Shard Capital. 31/07/2026
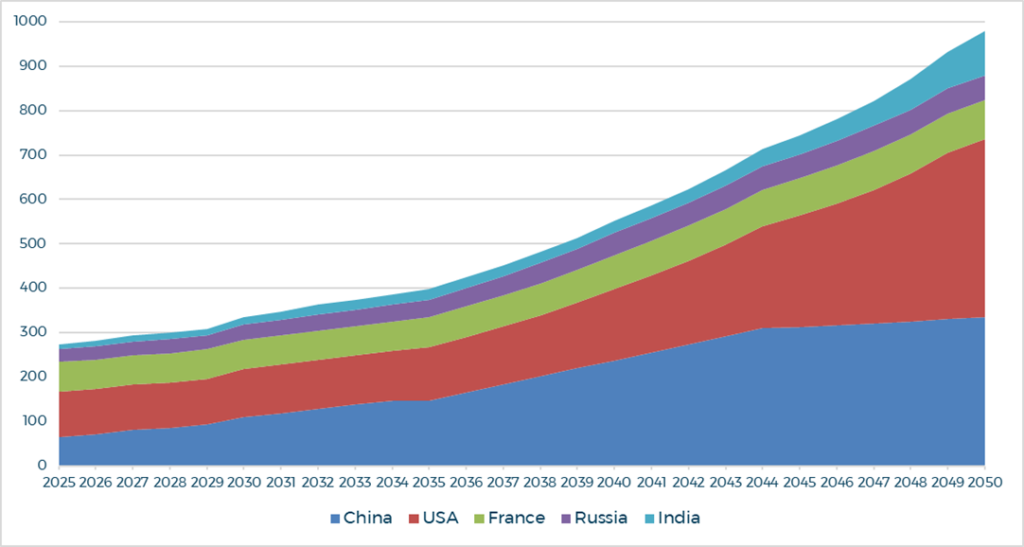
Exhibit 2: Nuclear capacity projections for China, France, India, Russia and USA, for the period 2025-2045 (GWe gross).
Whilst the US remains the country with the most Nuclear Energy capacity, the World Nuclear Association expects China to overtake the US by 2030. Expectations are then for the US to start catching up beyond 2045.
These projections are far below what is needed to achieve the transition objectives, avoid the disasters projected by global warming, and generate sufficient electricity to power future needs.
Source: World-Nuclear.org, Shard Capital, 31/07/2026
Measuring Supply: Power stations do not necessarily operate at full output continuously. Annual electricity generation can be stated as:
1 TWh / year = GW capacity x Capacity factor x 8.76
Comparing generating capacity solely in GW can be misleading: 1 GW of nuclear capacity may produce four to five times as much annual electricity as 1 GW of solar.
Market Review
Deflationary Boom Assets
(Equities, Corporate Bonds, EMD)
Risk assets paused in July, but beneath the flat headline performance was a pronounced rotation away from expensive growth. Global equities fell 0.12% (USD), with growth losing 1.88% (USD) while value gained 3.44% (USD). The UK led developed markets, rising 5.28% (USD), helped by its energy, mining and financial exposure as oil and industrial metals rallied. Japan advanced 1.39% (USD) and China gained 2.43% (USD), whereas Asia ex-Japan and emerging markets fell 3.37% and 3.26% (USD), respectively. The Nasdaq declined 3.19% (USD), although the Magnificent Seven gained 2.07% (USD), highlighting narrow leadership and investor scrutiny of returns on AI capital expenditure. Corporate bonds weakened as rising sovereign yields overwhelmed still-tight credit spreads; local-currency EMD gained 0.83%, benefiting from a 1.44% decline in the trade-weighted dollar.
Deflationary Bust Assets
(Government Bonds)
Government bonds sold off across regions. US Treasuries lost 1.11%, UK gilts 1.74% and euro-area government bonds 1.65%. The Federal Reserve held rates at 3.50%–3.75%, but three policymakers preferred a rate increase, reinforcing a higher-for-longer message. The US 10-year yield reached 4.75%, while the long end steepened sharply as investors questioned inflation control and absorbed elevated issuance.
Inflationary Boom Assets
(Commodities & Managed Futures)
This was July’s dominant regime. Brent surged 23.59%, the broader energy complex gained 14.74%, copper rose 3.65% and industrial metals advanced 3.34%. Escalating conflict around Iran, disrupted shipping through the Strait of Hormuz and falling US inventories drove a renewed supply-risk premium. Managed futures gained 0.51%, supported by established trends in energy, metals and currencies, although abrupt reversals limited returns.
Inflationary Bust Assets
(Precious Metals & Inflation-Linked Bonds)
Gold rose 0.95% and precious metals gained 0.73%, supported by geopolitical risk and a weaker dollar, but higher real and nominal yields restrained performance. Inflation-linked bonds declined: US TIPS lost 0.68%, UK linkers 1.92% and euro linkers 0.82%. June US inflation moderated, with headline CPI falling 0.4% month-on-month and core PCE easing to 3.3% year-on-year, but July’s oil shock revived near-term inflation concerns and left duration assets vulnerable.
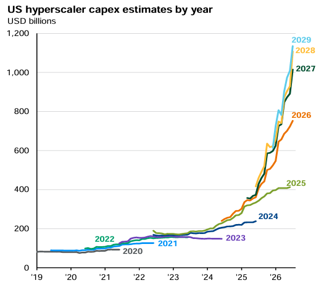
Exhibit 3: The AI investment cycle is still accelerating
Hyperscaler capital expenditure is expected to approach $1 trillion annually before the end of the decade, while corporate adoption of artificial intelligence continues to rise rapidly. The scale of investment implies that technology companies expect AI usage to expand far beyond today’s applications. However, it also raises questions over prospective returns on capital and the physical infrastructure required to support that growth.
Source: FactSet, McKinsey & Company, AI Index Report, Our World in Data, J.P. Morgan Asset Management. Data as of 31 July 2026.
CONTACT US
For further information on any of our services, or if you would like to arrange a meeting with an investment manager to see how we can work with you, please get in touch.
Disclaimer:
We try to ensure that the information provided is correct, but we do not give any express or implied warranty as to its accuracy. We do not accept any liability for errors or omissions. The content of this brochure is for guidance purposes only and does not constitute financial or professional advice.
Important information
Shard Capital Partners LLP is a limited liability partnership, registered in England with registration number OC360394. Shard Capital Partners LLP Registered office: Floor 3, 36-38 Cornhill, London, EC3V 3NG. Shard Capital Partners LLP is authorised and regulated by the Financial Conduct Authority in the United Kingdom, reference number 538762.
This document is provided for information purposes only and is intend for confidential and sole use by the recipient. It is not to be reproduced, copied or made available to others. The information set out in this document does not constitute investment advice or a personal recommendation. The views expressed in this document are not intended as an offer or a solicitation, to purchase or sell any security or other financial instrument, credit or lending product or to engage in any investment activity.
Past performance is not a guide to future performance. It is important that you understand that with investments, your capital is at risk. The value of investments, as well as the income derived from them, can go down as well as up and investors may get back less than the original amount invested. It is your responsibility to ensure that you make an informed decision about whether to invest with us, based on your particular objectives. If you are still unsure if investing is right for you, please seek independent advice.
The information and opinions expressed within this document are the views of (the company) and are based on information we believe to be reliable, but we do not represent that they are accurate or complete, and they should not be relied upon as such. Any information provided is given in good faith but is subject to change without notice.
No liability is accepted whatsoever by (the company) or its employees and associated companies for any direct or consequential loss arising from this document.
Disclaimer:
This document is provided for information purposes only and is intend for confidential and sole use by the recipient. It is not to be reproduced, copied or made available to others. The information set out in this document does not constitute investment advice or a personal recommendation. The views expressed in this document are not intended as an offer or a solicitation, to purchase or sell any security or other financial instrument, credit or lending product or to engage in any investment activity.
Past performance is not a guide to future performance. It is important that you understand that with investments, your capital is at risk. The value of investments, as well as the income derived from them, can go down as well as up and investors may get back less than the original amount invested. It is your responsibility to ensure that you make an informed decision about whether to invest with us, based on your particular objectives. If you are still unsure if investing is right for you, please seek independent advice.
The information and opinions expressed within this document are the views of (the company) and are based on information we believe to be reliable, but we do not represent that they are accurate or complete, and they should not be relied upon as such. Any information provided is given in good faith but is subject to change without notice.
No liability is accepted whatsoever by (the company) or its employees and associated companies for any direct or consequential loss arising from this document.